Best Network Monitoring Tools for IT Teams in 2026
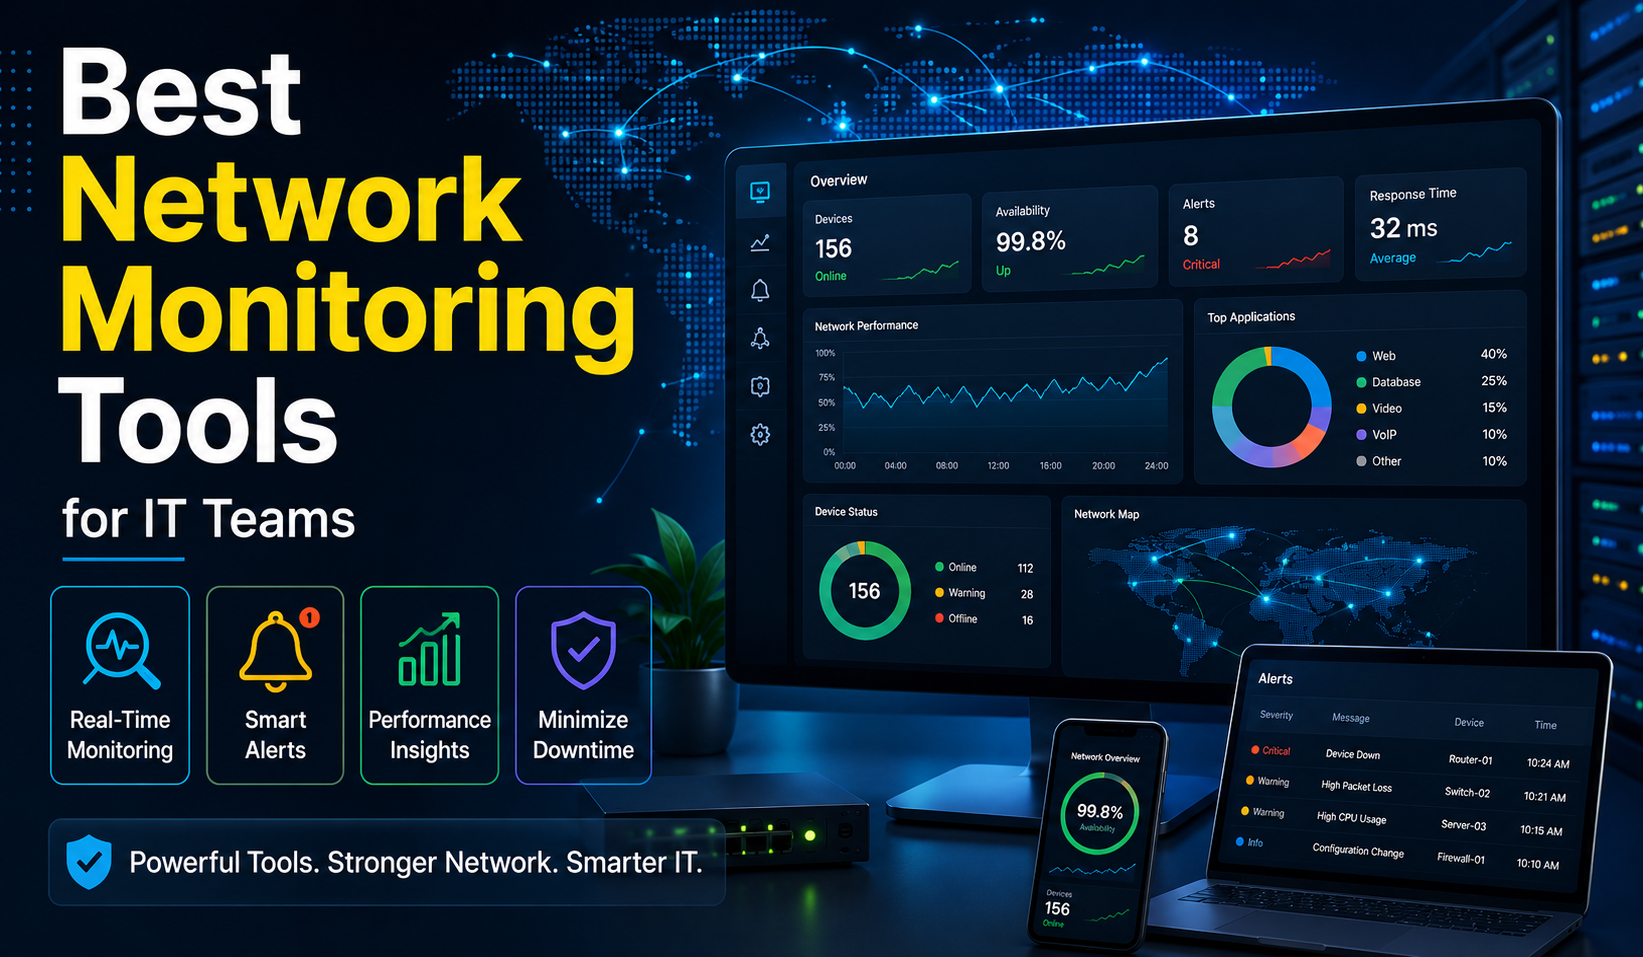
Best Network Monitoring Tools. Running a network without monitoring is like managing a warehouse with no inventory system. Things go missing, problems pile up, and by the time you notice, the damage is already done. The right monitoring tool changes that completely.
Over the years, working across different IT environments, one pattern keeps showing up: teams that catch problems early are not necessarily more skilled, they just have better tools giving them better information. This guide covers the nine best network monitoring tools available today, with honest details on pricing, strengths, and where each one falls short.
What is Network Monitoring?
Every router, switch, firewall, and server on your network is constantly generating data. Network monitoring is the discipline of collecting that data, making sense of it, and acting on it before something breaks. It runs continuously in the background, watching for faults, measuring performance, and keeping a historical record of how your environment behaves over time.
Two protocols do most of the heavy lifting:
| Protocol | Full Name | What It Does |
|---|---|---|
| SNMP | Simple Network Management Protocol | Tracks bandwidth, packet flow, and device performance across platforms. Lightweight and widely supported. |
| WMI | Windows Management Instrumentation | Built into Windows. Reads OS behavior directly, tracks service uptime, and monitors application health at a deeper level than most external tools. |
Beyond protocols, a good monitoring tool should use artificial intelligence to predict problems before they surface, not just alert you after the damage is done. The picture it builds from your routers, switches, servers, and firewalls should be clear enough to act on without digging through logs manually.
Why Network Monitoring Matters
Network downtime is not just a technical inconvenience. It is a business problem measured in missed transactions and lost productivity that compounds by the minute. A single outage can cost thousands of dollars before your team even identifies the source.
Here is what effective monitoring actually gives you:
- Faster troubleshooting: Real-time alerts combined with visual maps cut response time dramatically. Instead of chasing symptoms, you go straight to the source.
- Better performance: Continuously tracking CPU usage, latency, and bandwidth lets you tune the network proactively before degradation becomes noticeable.
- Security: Unusual traffic patterns are often the earliest signal of a cyberattack. Monitoring tools alert you fast enough to actually act on it.
- Compliance: Many industries require documented proof that systems were monitored and maintained. The logs your tool generates are the paper trail that compliance audits depend on.
Key Features to Look for in a Network Monitoring Tool
The features that matter most in day-to-day operations are not always the ones listed first on a vendor’s website. Here is what to actually prioritize:
| Feature | Why It Matters |
|---|---|
| Real-Time Monitoring | Live view of network activity at any moment |
| Automatic Device Discovery | Finds and adds devices without manual setup |
| Network Mapping | Visual diagram of connected devices for faster troubleshooting |
| Alerting | Notifications via SMS or email before users start calling |
| Performance Tracking | CPU, memory, disk usage, and bandwidth on one dashboard |
| Traffic Analysis | Shows which applications consume bandwidth and where bottlenecks form |
| Reporting | Historical trends ready for management without manual data pulls |
Paessler PRTG Network Monitor
PRTG is difficult to argue against in Windows environments. It comes with 321 native sensor types covering everything from network bandwidth to SQL Server health to Office 365 monitoring. One-second polling intervals mean your real-time data is genuinely current, not a delayed snapshot.
Core capabilities:
- Automatic discovery by IP address range with predefined sensors assigned instantly
- Visual mapping generated automatically after discovery
- Built-in monitoring for Active Directory, Exchange, SharePoint, IIS, Windows Event Logs, and WMI
- Custom monitoring through PowerShell scripts
- PRTG Data Exporter for enterprise data pipeline and third-party integrations
Pricing:
| Plan | Monthly Cost | Devices Covered |
|---|---|---|
| Free | EUR 0 | Up to 100 sensors |
| PRTG 500 | EUR 137 | ~50 devices |
| PRTG 1000 | EUR 242 | ~100 devices |
| PRTG 2500 | EUR 508 | ~250 devices |
| PRTG 5000 | EUR 908 | ~500 devices |
| PRTG 10000 | EUR 1,225 | ~1,000 devices |
All paid plans are billed annually. For Windows-native monitoring with minimal setup time and a wide range of built-in integrations, PRTG remains a strong benchmark.
2. NinjaOne
The honest pitch for NinjaOne is not that it monitors your network better than everything else. It is that it eliminates the sprawl of running five separate tools when one platform can handle monitoring, patch management, backup, automation, policy enforcement, and remote desktop access together.
Core capabilities:
- SNMP v1, v2, and v3 device discovery with automatic device role identification
- PowerShell scripting library and Windows update deployment
- Digital Employee Experience (DEX) management with self-service web and mobile portals
- Proactive automated remediation that resolves endpoint issues before users are affected
- Setup typically takes around one hour if you know your IP ranges
What works well: The consolidation of monitoring, patching, and backup into one platform genuinely reduces tool sprawl. Built-in remote desktop access removes the need for a separate tool.
Where it falls short: Chaining automation tasks together requires more effort than it should. Custom reporting for management takes more work than most teams want to spend.
Pricing is not shared publicly. A 14-day free trial is available.
3. Auvik
Auvik was built specifically for MSPs and distributed enterprises managing multiple client networks, and that focus shows in every part of the product. Cloud-hosted monitoring means no infrastructure to deploy. Automatic topology mapping and real-time network diagrams update as the network changes.
Core capabilities:
- Automatic topology mapping with real-time diagram updates
- Configuration change tracking and backup
- Syslog collection from Windows devices
- SNMP monitoring of Windows servers
- Most new users get genuine value within their first day without extensive training
What works well: Network visualization is outstanding. When something breaks, you see exactly where it is immediately.
Where it falls short: Cloud-based means internet connectivity is not optional. If your connection drops, monitoring goes with it. New users consistently report being overwhelmed by alerts during the first week before thresholds are properly configured.
Pricing is not shared publicly. A 14-day free trial is available.
4. Zabbix
Zabbix sits in a category of its own: enterprise-grade monitoring capabilities at zero licensing cost with full source code access. For budget-conscious IT teams with the technical depth to configure and maintain an open-source platform, nothing else comes close at this price point.
Core capabilities:
- Multi-tenant support with granular user permissions
- Advanced templating system for Windows environments
- Native Windows agent with WMI and Active Directory authentication integration
- Multi-level nested device discovery
- OAuth 2.0 SMTP authentication and TLS encryption between frontend and server
- New Host Wizard for guided host setup
What works well: Free licensing with full source code access. Integrates with most network environments without heavy customization.
Where it falls short: Not a point-and-click solution. Initial setup requires understanding the configuration model. Documentation for advanced configurations can be sparse enough that community forums become your primary resource.
No licensing costs. Completely free and open source.
5. Prometheus
Prometheus was not designed for traditional network infrastructure monitoring and makes no attempt to pretend otherwise. It was built for cloud-native environments where microservices and containers are constantly spinning up and down across dynamic infrastructures.
Core capabilities:
- Time-series database purpose-built for metrics storage at scale
- Pull-based data collection model for efficiency across large Kubernetes deployments
- PromQL query language for advanced data analysis
- Windows Exporter for Windows system metrics
- Grafana integration for visual dashboards
What works well: Outstanding for containerized application monitoring. PromQL gives DevOps teams advanced analysis capability that most traditional tools cannot match.
Where it falls short: Leaves significant gaps if your environment includes physical routers, switches, or traditional network infrastructure. Requires a separate Grafana installation for visualization.
Completely free and open source.
6. LogicMonitor
LogicMonitor’s core differentiator is its Edwin AI engine. After seeing how long manual root cause analysis takes during complex incidents, the value is immediately clear. Edwin AI analyzes log data automatically, handles AI agent auto-categorization of enrichment fields, and runs enhanced incident investigation workflows.
Core capabilities:
- SaaS deployment with no on-premises server required
- Internet Performance Monitoring and Digital Experience Monitoring via the Catchpoint acquisition
- Synthetic global vantage point monitoring across internet paths
- Pre-built integrations with over 2,000 technologies
- Automatic updates with no maintenance overhead
Real-world example: NTT integrated LogicMonitor with ServiceNow CMDB to automate hybrid infrastructure monitoring, accelerating customer migrations and improving business agility without maintaining legacy monitoring components.
What works well: AI-powered anomaly detection catches issues human operators miss. Cloud-based model eliminates on-premises monitoring servers entirely.
Where it falls short: Internet connectivity required. Can become expensive at scale. Advanced features carry a learning curve despite the clean interface.
Pricing is not shared publicly. A 15-day free trial is available.
7. SolarWinds Network Performance Monitor
SolarWinds NPM operates at a scale most tools cannot match. Supporting up to 50,000 network elements across on-premises, cloud, and hybrid environments, it was built for large enterprise networks where multi-vendor complexity is the norm.
Core capabilities:
- Network topology discovery through ICMP, SNMP, and WMI simultaneously
- NetPath for hop-by-hop network path visualization
- Quality of Experience (QoE) dashboard for end-user impact tracking
- WMI-based Windows server monitoring with Event Log correlation
- RESTful API for custom integrations
- 16 built-in alert delivery methods including SMS, email, and SNMP traps
Real-world usage:
- GTL uses NPM for real-time visibility into inventory at scale
- Flathead County uses NPM with the Engineer’s Toolset for real-time alerts on server downtime, low disk space, and memory overutilization
What works well: Intuitive interface accessible even to less experienced engineers. Wide coverage including SLA tracking, configuration backup, and traffic graphs. Uptime percentage reporting proves valuable in financial discussions with management.
Where it falls short: High price point. Initial setup is complex and resource-intensive. Not suitable for smaller organizations on a tight budget.
Pricing is not shared publicly. A 30-day free trial is available.
8. LiveAction LiveNX
LiveNX occupies a specific niche: large and complex network environments where deep packet inspection and flow analysis are the primary diagnostic requirements. It goes beyond what generalist monitoring tools surface.
Core capabilities:
- Deep packet inspection and flow analysis
- Network path visualization across multiple hops
- Application performance monitoring and bandwidth utilization tracking
- Windows-based deployment with direct domain infrastructure integration
- Windows performance correlation for Windows-based network applications
Best suited for organizations where standard SNMP polling does not provide enough diagnostic depth.
Pricing is not shared publicly. A 14-day free trial is available.
9. ManageEngine OpManager
OpManager’s practical advantage is breadth combined with accessibility. It monitors over 2,000 performance metrics across a wide range of devices, works with non-SNMP devices, and functions as an SNMP trap receiver all at once.
Core capabilities:
- Monitoring of over 2,000 performance metrics
- Native Windows Server and Linux deployment options
- Approximately 300 device templates for quick setup
- Dynamic CVE ID search in the Firmware Vulnerability page
- SNMPv3 handshake stability fixes and improved interface discovery syncing
Pricing:
| Edition | Price | Device Limit |
|---|---|---|
| Free | $0 | Up to 10 devices |
| Professional | From $245 | 25 devices |
| Enterprise | Contact vendor | Larger deployments |
The free edition makes it genuinely accessible for small teams evaluating whether a dedicated monitoring platform fits before committing budget.
How to Choose the Right Tool for Your Needs
The decision is simpler than most vendor comparison guides suggest. Start with your environment and your team’s capacity.
| Your Situation | Best Options |
|---|---|
| Windows-heavy with Active Directory | Paessler PRTG, SolarWinds NPM |
| MSP or multi-site management | Auvik, NinjaOne |
| Tight budget, strong technical team | Zabbix, Prometheus |
| DevOps, Kubernetes, containerized apps | Prometheus + Grafana |
| Large enterprise, multi-vendor, AI insights | SolarWinds NPM, LogicMonitor |
Every tool on this list offers a free trial. The best way to make the final call is to test your top two choices against your actual infrastructure for a week and see which one gives you the clearest, most actionable picture of your network.